Southern Ontario Heavy Snowfall: Recent Storms and Outlook
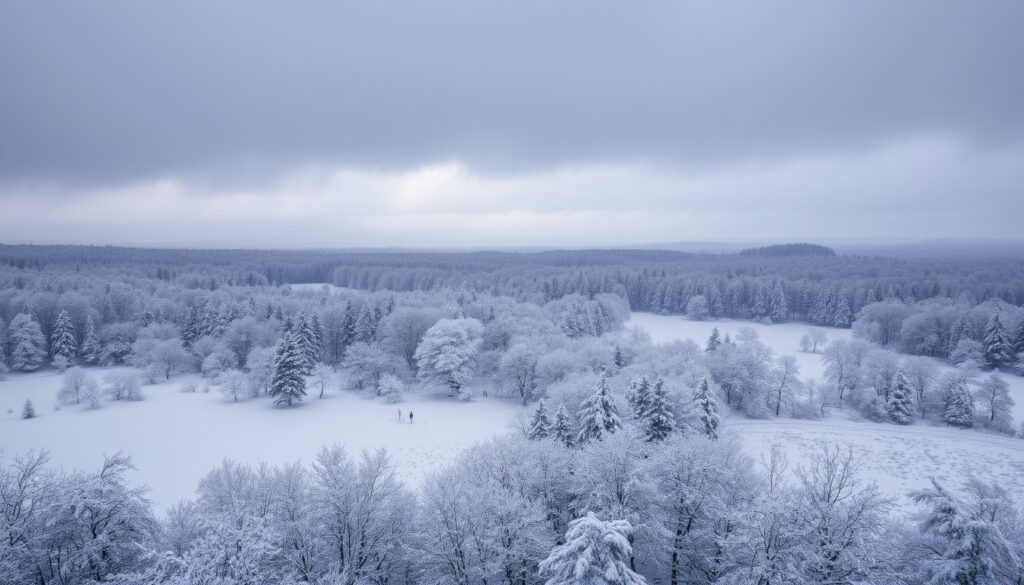
Anyone who’s spent a winter in Southern Ontario knows the drill: just when you’ve packed away the heavy coat, another system rolls off the lakes and dumps snow across the region. That’s happening again — Environment Canada forecasts 5 to 10 centimetres of accumulation in areas like Niagara-on-the-Lake by 30 April 2026, with terrain like the Niagara Escarpment likely seeing higher amounts. This article breaks down what’s driving the snow, what communities are experiencing, and what decades of climate data reveal about shifting patterns.
Niagara-on-the-Lake forecast: 5-10 cm ·
Near Lake Ontario shore: 2 cm ·
Wind gusts: 50 km/h ·
Peak snowpack month: March (21 of 30 years)
Quick snapshot
- 5-10 cm accumulating snow expected in Niagara-on-the-Lake on 30 April 2026 (Environment Canada)
- Snowfall reduced to 2 cm near Lake Ontario shoreline (Environment Canada)
- Southern Ontario snow days declining at −0.29 days per year (PMC Study on Snow-Day Fraction)
- Exact 24-hour accumulation totals for Toronto specifically
- How 2026 GTA storm totals compare to historical averages
- Whether late-April snow events are increasing or decreasing in frequency
- 30 April 2026: Next lake-effect snow event expected in Niagara region
- March 2026: 3/10 lake ice coverage recorded in Saginaw Bay
- Post-2000: Earlier snow detection and faster losses observed
- Travel disruptions likely for Southern Ontario highways
- Precipitation may shift from rain to snow mid-event
- Climate data suggests longer-term decline in snow days despite short-term events
Environment Canada’s data confirms specific snowfall variations across Southern Ontario communities during lake-effect events.
| Label | Value |
|---|---|
| Latest Warning | 5-10 cm snowfall (Niagara-on-the-Lake) |
| Affected Areas | Southern Ontario, Niagara region, near Lake Huron |
| Source | Environment Canada official forecasts |
| Storm Type | Lake-effect snow system |
| Wind | 30 km/h gusting to 50 km/h |
| Peak SWE Period | March (21 of 30 years analyzed) |
The pattern shows measurable differences even within short distances — a few kilometres can mean the difference between 2 cm and 10 cm of accumulation.
Why does southern Ontario get so much snow?
Southern Ontario sits in one of the most snow-prone regions in Canada, and the reason comes down to the Great Lakes themselves. When frigid arctic air masses sweep across the relatively warmer open water of Lake Ontario, Lake Erie, and Lake Huron, moisture evaporates rapidly — that moisture cools and condenses as it hits the colder land, dumping concentrated snowfall on the downwind shores.
Lake-effect snow mechanism
Environment Canada defines lake-effect snow as a phenomenon where cold air moves over much warmer lake water, creating an unstable atmosphere that generates persistent snow bands. The process works best when lake water remains unfrozen — which is why open water percentage matters. On 14 March 2026, marine forecasts showed only 3/10 thick lake ice coverage in southern Saginaw Bay and along eastern shores, conditions that strongly favor lake-effect snow development.
Lake-effect dumps heavy snow within kilometres of the shore while leaving areas just inland comparatively dry. The escarpment terrain amplifies this effect — higher elevations squeeze additional precipitation from the air mass, creating sharp local variations that a single regional forecast cannot capture. This means communities along the Niagara Escarpment often receive significantly more snow than areas just a short distance away, even within the same storm system.
Great Lakes influence
The Great Lakes collectively act as snow-making machines from late fall through early spring. Research from the PMC study on snow-day fraction shows freezing days correlate with snow accumulation at rates explaining 61-76% of the variability in Southern Ontario cities during winter months.
Lake ice extent directly affects how much moisture is available for lake-effect events. As climate patterns shift, the balance between ice coverage and open water will determine whether heavy snowfall events become more or less frequent in specific communities. The implication: municipalities near the Great Lakes shores need to monitor ice coverage data alongside traditional snowfall forecasts.
How much snow did Toronto get in the last 24 hours?
For Toronto specifically, recent Environment Canada data shows accumulation near the Lake Ontario shoreline tends to be significantly lower than inland areas. During the 30 April 2026 event, the forecast called for only 2 centimetres near the lake shore at Niagara-on-the-Lake, while areas just a few kilometres away from the water received 5 to 10 centimetres.
Recent measurements
Environment Canada’s local forecasts for the Niagara region provide granular detail: precipitation may start as rain along the Lake Ontario shore and Niagara Peninsula before transitioning to snow, with total accumulation remaining modest (2 cm) near the water. The same system produces 5-10 cm accumulation in areas like Niagara-on-the-Lake where lake-effect enhancement is stronger.
Impacts reported
Difficult winter driving conditions have been flagged by Environment Canada as a consequence of these April snowfall events. Wind gusts of 50 km/h accompanying the precipitation create additional hazards — reduced visibility and slippery roads even where total accumulation appears modest.
Motorists should report severe conditions to ONstorm@ec.gc.ca or via the #ONStorm hashtag so forecasters can refine their models in real time.
How much snow did Toronto get this winter?
When looking at seasonal totals across Southern Ontario cities, the longer-term trend tells a cautionary story about assumptions. A PMC study analyzing 50 years of data through approximately 2022 found that total snow days in cities like Toronto, Ottawa, Hamilton, and London were decreasing at a rate of 0.29 days per year — roughly one fewer snow day every 3.5 winter seasons.
Seasonal totals
The MNRF snow cover data from 1980-2010 reveals that maximum snow water equivalent — essentially how deep the snowpack sits before spring melt — occurs most commonly in March. Of 30 years analyzed, 21 showed peak SWE in March, with the remaining nine peaking in February. Ontario watersheds showed significant negative trends in maximum SWE during January, February, and May, declining at rates of 1.2 to 2.0 millimetres per year.
Comparisons
Average winter temperatures alone explain 57% of the variability in snow-day fraction across Southern Ontario. The correlation is striking: Mississauga shows a decreasing trend that researchers note isn’t statistically significant, unlike Hamilton, Toronto, and London where the decline is measurable and significant. This suggests local factors — urban heat island effects, proximity to water, microclimates — all play a role in determining which communities see the most pronounced changes.
The pattern suggests Toronto, Hamilton, and London residents should expect fewer snow days going forward, while Mississauga’s trajectory remains less predictable.
Who is tracking Southern Ontario snowfall?
Several institutions actively monitor and record snowfall data across Southern Ontario, providing the foundation for both short-term forecasts and long-term climate analysis.
Specific locations
Environment Canada operates the primary monitoring network, issuing forecasts and warnings through public bulletins for the Southern Ontario region. Their system incorporates real-time data from marine forecasts covering Lake Erie and Lake Ontario, including snow and ice conditions that affect lake-effect development.
Extreme cases
The Ontario Climate Data Portal maintained by York University provides snow indices broken down by subregion, enabling detailed analysis of how different communities experience snowfall patterns. Historical climate data remains accessible through Environment Canada’s climate portal, allowing researchers and the public to examine multi-decade trends.
For municipal planners, infrastructure managers, and residents, knowing which agency tracks what data matters. Environment Canada handles warnings and forecasts; historical data lives with their climate portal; research institutions like York University and the MNRF provide the analytical layer that turns raw numbers into actionable trend information. The catch: without understanding these distinctions, it’s easy to miss relevant data when making decisions about winter preparations or long-term climate adaptation.
What is the southern Ontario heavy snowfall forecast?
Looking ahead, Southern Ontario faces the familiar pattern of lake-effect snow systems moving through the region, but climate data suggests the overall frequency of snow days is declining even as individual heavy events still occur.
Upcoming systems
The immediate forecast for 30 April 2026 shows a clipper-type system bringing accumulating snow of 5 to 10 centimetres to Niagara-on-the-Lake, with wind northeast at 30 km/h gusting to 50 km/h. Temperatures around 3°C during the day create conditions where precipitation may start as rain near the Lake Ontario shore before switching to snow as temperatures drop. The Niagara Escarpment terrain will likely see higher amounts than the shoreline areas.
Travel warnings
Environment Canada has flagged difficult winter driving conditions for Southern Ontario highways during snow events. The combination of wet snow accumulation, gusting winds, and potential freezing rain at transition periods creates hazardous road conditions.
Timeline
- MNRF data shows significant negative trends in maximum snow water equivalent across Ontario watersheds (MNRF Snow Cover Trends)
- Earlier snow detection and faster snow cover losses observed in Ontario SCE data (MNRF Snow Cover Trends)
- Snow beginning with freezing rain risk in Southern Lake Huron, Lake Erie, and Lake Ontario — only 3/10 lake ice coverage in Saginaw Bay (Environment Canada Marine Forecast)
- 5-10 cm snow expected in Niagara-on-the-Lake, with 2 cm near Lake Ontario shore and gusts to 50 km/h (Environment Canada)
Confirmed vs. Unclear
Confirmed facts
- 5-10 cm accumulating snow in Niagara-on-the-Lake on 30 April 2026
- 2 cm near Lake Ontario shoreline during same event
- Snow days decreasing at −0.29 days per year in Southern Ontario cities
- Maximum snow water equivalent declining 1.2-2.0 mm/year in January, February, May
- Wind gusts to 50 km/h accompanying April snow event
- Lake ice at 3/10 coverage in Saginaw Bay on 14 March 2026
What remains unclear
- Exact 24-hour accumulation figures for Toronto specifically
- Whether late-April snow events are becoming more or less common
- How 2026 compares to historical peak snowfall months
- Updated lake-effect snow data post-2010 beyond Niagara-on-the-Lake
What experts say
Accumulating snow likely today. Snowfall amounts of 5 to 10 cm. Amounts may be lesser near the shore of Lake Ontario.
— Environment Canada official forecast for Niagara-on-the-Lake (Environment Canada)
Total snow days were decreasing at an even faster rate of 1 less snow day every 3.5 winter seasons (−0.29 days/year).
— Researchers analyzing 50 years of Southern Ontario snow data (PMC Study on Snow-Day Fraction)
Higher snowfall amounts may be possible over the higher terrain of the Niagara Escarpment.
— Environment Canada official forecast for Niagara-on-the-Lake (Environment Canada)
Related reading: Remembrance Day statutory holiday Ontario
weather.gc.ca, lamps.math.yorku.ca, weather.gc.ca, climate.weather.gc.ca, weather.gc.ca, canada.ca, weather.gc.ca, ruralontarioinstitute.ca
Recent lake-effect activity in the region intensifies alongside the multi-day Southern Ontario snow squalls forecast threatening 20-50 cm accumulations in snowbelt zones near Niagara and Toronto.
Frequently asked questions
What causes lake-effect snow in Southern Ontario?
Lake-effect snow occurs when cold arctic air masses move over relatively warmer Great Lakes water. The temperature differential causes rapid evaporation, and as that moisture-laden air passes over colder land, it dumps concentrated snowfall on downwind shores. The effect is strongest when lake water remains open and ice-free.
How does heavy snowfall affect travel in Toronto?
Toronto’s proximity to Lake Ontario typically moderates its lake-effect snow totals — the city often receives less accumulation than areas slightly inland. However, gusting winds up to 50 km/h can create hazardous driving conditions with reduced visibility and slippery roads even from modest snow events.
What are average winter snow totals for Southern Ontario?
Climate data shows peak snow water equivalent occurs most commonly in March (21 of 30 years analyzed). Ontario watersheds showed maximum SWE declining at 1.2-2.0 mm/year during January, February, and May from 1980-2010, with snow days declining overall at 0.29 days per year in major cities.
Is more snow expected in Southern Ontario soon?
Environment Canada forecast 5-10 cm of accumulation for Niagara-on-the-Lake on 30 April 2026, with 2 cm near the Lake Ontario shoreline. Wind gusts to 50 km/h are expected, and difficult winter driving conditions have been flagged for Southern Ontario highways.
How to prepare for heavy snowfall in Ontario?
Check Environment Canada forecasts and any active weather warnings before travel. Report severe conditions to ONstorm@ec.gc.ca or via #ONStorm on social media. Ensure vehicles are winter-ready, allow extra travel time, and be aware that precipitation may shift from rain to snow during April events.
What was the impact of the recent GTA storm?
The most recent Environment Canada data shows accumulation in the GTA region near Lake Ontario shoreline remains modest (2 cm) even during lake-effect events, while areas like Niagara-on-the-Lake see 5-10 cm. The pattern suggests GTA communities closer to the lake benefit from reduced lake-effect enhancement.
Which areas near Great Lakes get most snow?
Areas downwind of the Great Lakes receive the heaviest lake-effect snow. The Niagara Escarpment sees higher amounts due to terrain forcing additional precipitation from air masses. Near-shore areas along Lake Ontario often receive less snow than inland locations during the same event, as seen in the 2 cm versus 5-10 cm difference during the 30 April 2026 forecast.
More related posts
 Adrienne Arsenault: Bio, Ring, Salary, Partner, and More
 2024 NHL Playoff Bracket: Results, Format & Printable PDF
 Indigo Bay and Bloor: Hours, Events, Products & Parking
 Dave Foley: Biography, Career, and Personal Life
 Below Deck Down Under: watch, cast, season 3, Aesha, answers
 Seargeoh Stallone: What Happened to Sylvester Stallone’s Son
 Canelo Alvarez: Record, Net Worth, Next Fight & Family
 Kirsten Dunst: Age, Husband, Children, and FAQs